Real-World Codex Session Efficiency
What actually makes real Codex coding sessions expensive in token processing? To find out without consuming live quota, we performed a retrospective observational study of 299 historical Codex session rollout files spanning 110 calendar days of real-world development on macOS. After applying strict deduplication to eliminate rate-limit rebroadcasts, we analyzed 18,077 true model responses, 2.089 billion logical input tokens, 78 compaction events, and 71 clean isolated quota episodes.
Processed across 18,077 deduplicated model responses (95.7% cached overall).
Median context fell from 223k down to 27k tokens across 78 observed events.
In 71 isolated episodes, 5h meter moved with input (ρ=0.82) vs user turns (ρ=0.44).
Q4 tool-heavy sessions processed 3.09M tokens vs 25.5k for single-turn sessions.
This study is a retrospective observational analysis of natural developer sessions, distinct from the controlled one-variable experiments on our primary research page. It analyzes real-world token logs and server rate-limit headers emitted during everyday programming. All data is sanitized, zero Codex API quota was consumed, and no causal claims or subscription quota formulas are asserted.
Summary of Validated Findings
Every finding below has undergone strict validation gating, eliminating rate-limit rebroadcasts and standardizing cache terminology.
| Finding Area | Sample Size | Observed Telemetry | Analytical Interpretation |
|---|---|---|---|
Compaction context drop & cache disruption Strong Empirical | 78 validated events | Compaction immediately reduces prompt input by median 87.9% (223k to 27k tokens). However, cached-input share drops from 99% to 42% on response +1 before recovering to 94% by +3. | Significant context headroom is restored, but the initial post-compaction response triggers fresh prefix computation. |
Compaction context recurrence thresholds Observational | 78 validated events | Following compaction, 84.6% of sessions reached 50k tokens (median 8 responses), 62.8% reached 100k (median 31 responses), and 26.9% reached 200k (median 98 responses). | Disproves earlier linear speculation that context re-crosses 100k in 9 turns; context accumulation depends on session continuation length. |
Isolated 5-hour quota-meter rank alignment Observational Cohort | 71 clean episodes | Observed 5-hour percentage-point movement correlated strongly with total input (rho 0.82) and model responses (rho 0.81), but weakly with user turns (rho 0.44). | In isolated local windows, quota movement closely mirrors cumulative token volume and autonomous agent cycles rather than human prompt count. |
Model-cycle amplification in low-prompt sessions Stratified Telemetry | 203 sessions (<=5 turns) | At exactly 2 user turns (n=71), sessions with heavy autonomous loops evaluated median 3.09M input tokens across 34 responses vs 25.5k tokens across 1 response in single-turn sessions (121.2x). | Repeated autonomous tool calls re-evaluate saturated context on every iteration, multiplying prompt evaluation volume under fixed human prompt counts. |
High cached-input share at high context Strong Empirical | 18,077 responses | Overall prompt caching achieved 98.0% median cached-input share. When context exceeded 128k tokens, median cached share reached 98.7% to 99.0%. | Prompt caching is highly effective at absorbing large repetitive prefixes, but does not mean high context is free of quota impact. |
Non-cached input concentration Observational | 18,077 responses | The top 5% of responses account for 41.6% of all non-cached input tokens, heavily driven by initial turn cold-starts (24.5%) and immediate post-compaction invocations (10.4%). | Fresh prefill computation is not evenly spread; it concentrates at thread boundaries and context-reshaping events. |
Compaction Event Study: Immediate Headroom vs Prefix Disruption
Across 78 validated compaction events immediately preceding a model response, context compaction produced a dramatic reduction in working memory alongside an immediate disruption to prompt caching.

Figure 1: Observed median input tokens and cached-input share at Response -1 (pre-compaction) versus Response +1 (post-compaction) across 78 events.
Checkpoint Medians Around Compaction (Offsets -5 to +10)
| Response Offset | Observed Events (n) | Median Input Tokens | Median Cached Share | Median Non-Cached | Context Utilization |
|---|---|---|---|---|---|
| Response -5 | 78 | 215,287 | 99.0% | 1,382 | 83.1% |
| Response -3 | 78 | 219,623 | 99.0% | 2,011 | 85.0% |
| Response -1 (Pre-compaction) | 78 | 223,312 | 99.0% | 2,516 | 86.4% |
| Response +1 (Post-compaction) | 78 | 26,970 | 42.0% | 16,995 | 10.5% |
| Response +3 | 75 | 30,799 | 94.0% | 1,828 | 11.8% |
| Response +5 | 75 | 37,530 | 94.0% | 2,006 | 14.5% |
| Response +10 | 69 | 54,271 | 96.0% | 1,730 | 20.6% |
*Context utilization evaluated against the 258,400 token effective working capacity for GPT-5/6 series models.
What the Telemetry Shows
- Immediate Context Drop: Input context drops by median 87.9% (-196,342 tokens), falling from 223,312 down to 26,970 tokens.
- Prefix Cache Shock: Because compaction rewrites earlier history into a condensed summary block, the prompt prefix changes. Cached-input share drops from 99.0% down to 42.0% on Response +1, causing a transient surge in non-cached input (median 16,995 tokens).
- Fast Cache Rebound: By Response +3, cached-input share recovers to 94.0%, and reaches 96.0% by Response +10.
Observed Context Recurrence
Following compaction, context accumulates as new tool executions occur. Among the 78 events:
- 50,000 tokens:66 / 78 (84.6%) in median 8 responses
- 100,000 tokens:49 / 78 (62.8%) in median 31 responses
- 150,000 tokens:36 / 78 (46.2%) in median 51.5 responses
- 200,000 tokens:21 / 78 (26.9%) in median 98 responses
- Context Reduction ≠ Quota Savings: Compacting history reduces prompt size inside the session, preventing context overflow errors. However, this study cannot determine whether compaction saves subscription quota allowance, because the compaction operation itself requires inference and modifies prefix caching.
- Manual vs. Auto Indistinguishable: The Codex CLI schema emits an identical
compactedpayload whether triggered manually by the developer typing/compactor automatically when context crosses ~90% capacity. - Observational Phrasing: We describe cache changes as occurring after or following compaction, not as a proven causal effect.
Zero-Quota Retrospective Quota-Meter Analysis (n = 71)
To investigate how Codex subscription meters behave in real-world use without consuming quota, we isolated historical sessions that met six strict single-session criteria.
“In 71 historical Codex sessions where we could isolate a single local session within one unchanged five-hour quota window, observed five-hour meter movement was more strongly associated with total processed input (Spearman ρ=0.82), model-response count (ρ=0.81), and maximum context size (ρ=0.78) than with the number of user turns (ρ=0.44). This is observational evidence, not a quota formula or causal estimate.”
Of the 71 qualifying episodes, 66 exhibited positive meter movement (>0 percentage points) and 5 exhibited zero movement (0 percentage points).
Spearman Rank Correlation with 5-Hour Percentage-Point Movement
| Session Metric | Spearman ρ | Analytical Interpretation |
|---|---|---|
| Total logical input tokens | 0.8182 | Very strong monotonic alignment with 5-hour quota movement |
| Cached input tokens | 0.8137 | Nearly identical to total input, reflecting high cache saturation |
| Model-response count | 0.8132 | Cycles of agent generation track meter movement closely |
| Maximum input tokens | 0.7828 | Peak context evaluated during the session |
| Non-cached input tokens | 0.7624 | Fresh prompt prefill volume |
| Tool-call count | 0.7507 | Frequency of client command/file executions |
| Maximum context utilization | 0.7451 | Peak percentage of model window used |
| Median input tokens per response | 0.7443 | Average prompt weight throughout session |
| Duration (seconds) | 0.6319 | Moderate alignment; wall-clock time is noisier than token counts |
| Compaction count | 0.5383 | Occurs only in long, context-saturated sessions |
| User turns (human prompts) | 0.4396 | Substantially weaker alignment than automated agent activity |
- Criteria: Sessions had start and end rate-limit headers; identical 5-hour reset anchors (
resets_at); non-decreasing percentages; zero local concurrency; integer meter precision; and clean deduplicated telemetry. - No Remote Proof: While local rollout files confirm zero concurrent local sessions, local telemetry cannot prove that a remote surface (such as ChatGPT web or a second laptop) did not interact with the account during that window.
- No Variance Explained: We do not square ρ or claim that token counts “explain 82% of quota.” Spearman ρ reflects monotonic rank ordering only.
- Not a Formula: OpenAI does not publish the internal formula used to debit subscription meters.
Model-Cycle Amplification in Low-Prompt Sessions
Developers are frequently surprised when a session with only 2 or 3 prompts consumes a substantial portion of quota. Our data demonstrates that model-response count and cumulative input tokens vary dramatically even when holding user prompts constant.
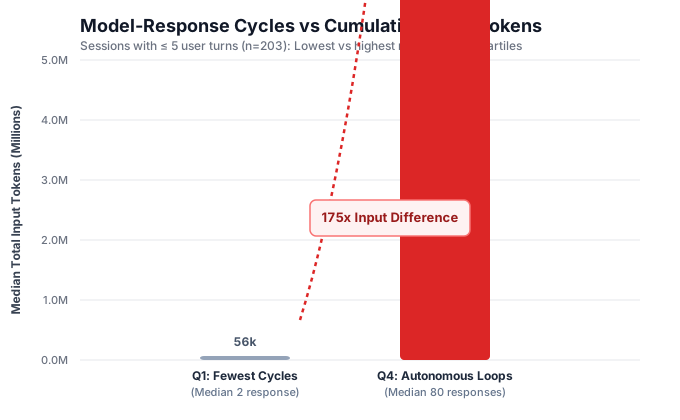
Figure 2: Distribution of model response count and cumulative logical input tokens in sessions with ≤ 5 user turns (n = 203).
Stratified Comparison by Exact User-Turn Count
To prevent user prompt count from confounding the analysis, we segmented sessions with ≤ 5 user turns ($n = 203$) into exact user-turn strata, comparing the lowest quartile of model responses (Q1) against the highest quartile (Q4):
| Exact User Turns | Sample Size (n) | Q1 Median Resp. | Q1 Median Input | Q4 Median Resp. | Q4 Median Input | Q4 / Q1 Input Factor |
|---|---|---|---|---|---|---|
| 2 User Turns | 71 | 1.0 | 25,469 | 34.0 | 3,087,843 | 121.2x |
| 3 User Turns | 32 | 8.5 | 270,999 | 97.5 | 14,129,336 | 52.1x |
| 4 User Turns | 53 | 16.0 | 705,563 | 88.0 | 9,229,990 | 13.1x |
| 5 User Turns | 45 | 23.0 | 960,589 | 102.0 | 10,817,932 | 11.3x |
*The 1-turn stratum ($n=2$) is omitted from the table due to small sample size (Q1: 160k tokens vs Q4: 6.8M tokens).
Mechanical Coupling & Non-Causal Interpretation
In multi-turn chat architectures, each model response evaluates the current conversation history. Therefore, cumulative session input is mathematically the sum of contexts evaluated across all responses. The extreme variation between Q1 and Q4 illustrates that an agent running repeated tool loops (e.g. running builds, inspecting files, executing linters) re-evaluates saturated context dozens of times without human intervention.
We do not claim that model cycles “cause” 121x cost, nor that model cycles explain a specific percentage of billing. The numbers provide a descriptive baseline of how autonomous agent execution operates in practice.
Context Carryover & Non-Cached Input Concentration
How does context size evolve over a session's lifecycle, and how effectively does prompt caching buffer long-running threads?
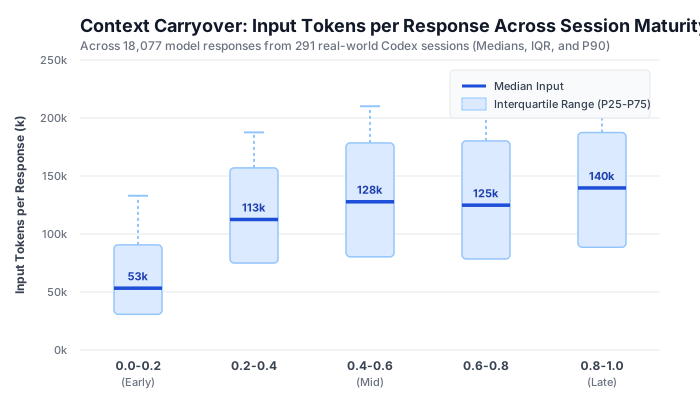
Figure 3: Context expansion across normalized session progress.
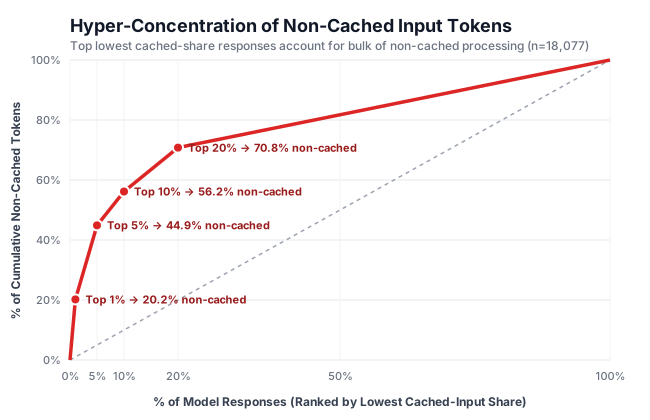
Figure 4: Lorenz concentration curve of non-cached prompt tokens.
Context Expansion Dynamics
- Saturated Operation: 62.88% of all cumulative token processing occurred while context exceeded 128,000 tokens (50% utilization of the 258.4k window).
- Early vs Late Expansion: In threads lasting ≥ 5 turns, responses in the final 20% of session progress evaluated a median of 138,590 input tokens compared to 54,120 tokens in the initial 20%.
- Within-Session Expansion: Across multi-turn sessions, the first-to-last response ratio expanded by a median of 5.10x (IQR: 3.18x to 7.36x).
Non-Cached Input Concentration
- High Cache Resiliency: Overall median cached-input share was 98.0%.
- Severe Concentration: The top 5% of responses account for 41.6% of all non-cached input tokens (37.3M tokens).
- Triggers for Cold Starts: Low-cache events (<50% cached-input share) occurred in 636 instances, primarily triggered by initial turn cold-starts (24.5%) and immediate post-compaction turns (10.4%).
A 98% cached-input share indicates that the prompt prefix matched provider cache, avoiding repeated prefill computation. However, our 71-session quota analysis demonstrates that observed 5-hour quota consumption remains strongly associated with total processed input (ρ = 0.82) and cached input (ρ = 0.81). We do not know OpenAI's internal quota weighting, but empirical evidence confirms that large contexts carrying high cache shares still coincide with substantial quota movement.
Methodology, Deduplication & Data Downloads
All analysis was conducted locally on macOS without executing live Codex runs or consuming quota. Identifiers were cryptographically hashed to safeguard privacy.
The Token Deduplication Hard Gate
In auditing the historical rollouts, we identified that Codex CLI emits event_msg/token_count events during asynchronous rate-limit updates while repeating the previous nonzero last_token_usage verbatim, even though cumulative usage has not advanced.
We eliminated 183 unadvanced events (105 duplicate nonzero responses that previously injected 13.9M phantom tokens, and 78 zero-usage events). For CLI builds ≥ 0.153.0 (77 files, 2,729 responses), we prioritized the canonical top-level token_usage_record. An automated regression test ensures no duplicate rate-limit events enter the dataset.
299 sanitized session rows with aggregate token, response, tool, and rate limit counters (88 KB).
18,077 clean, deduplicated model response records with prompt, cache, and tool metrics (2.7 MB).
Complete structured statistical outputs, percentiles, correlation matrices, and event distributions (97 KB).
sess_[hash] and repo_[hash]). Neither raw prompts, assistant prose, source code, file paths, nor user credentials were extracted or saved.Limitations & What This Study Cannot Establish
To maintain scientific integrity, we explicitly document what our observational telemetry cannot prove:
Natural developer logs observe what happened during real work, but cannot prove what would have happened under counterfactual conditions. Establishing whether compaction or handoffs are net quota-efficient requires a future controlled trial with identical frozen tasks.
OpenAI does not publish the exact mathematical formula mapping input tokens, reasoning tokens, and cached tokens to subscription percentage points. Strong rank correlation (ρ = 0.82) confirms alignment, but is not a pricing model.
Rollout telemetry records client-side token counts, but does not record cache write pricing surcharges, server-side eviction TTLs, or hardware tier allocation.
Data was gathered from a single macOS developer workstation. While community audit reports independently report similar long-thread behaviors, workflow style and repository structure vary across organizations.
Compare these real-world findings with our controlled, frozen-task measurements across models, reasoning levels, and Fast mode.